Another Signal for Lower U.S. Yields
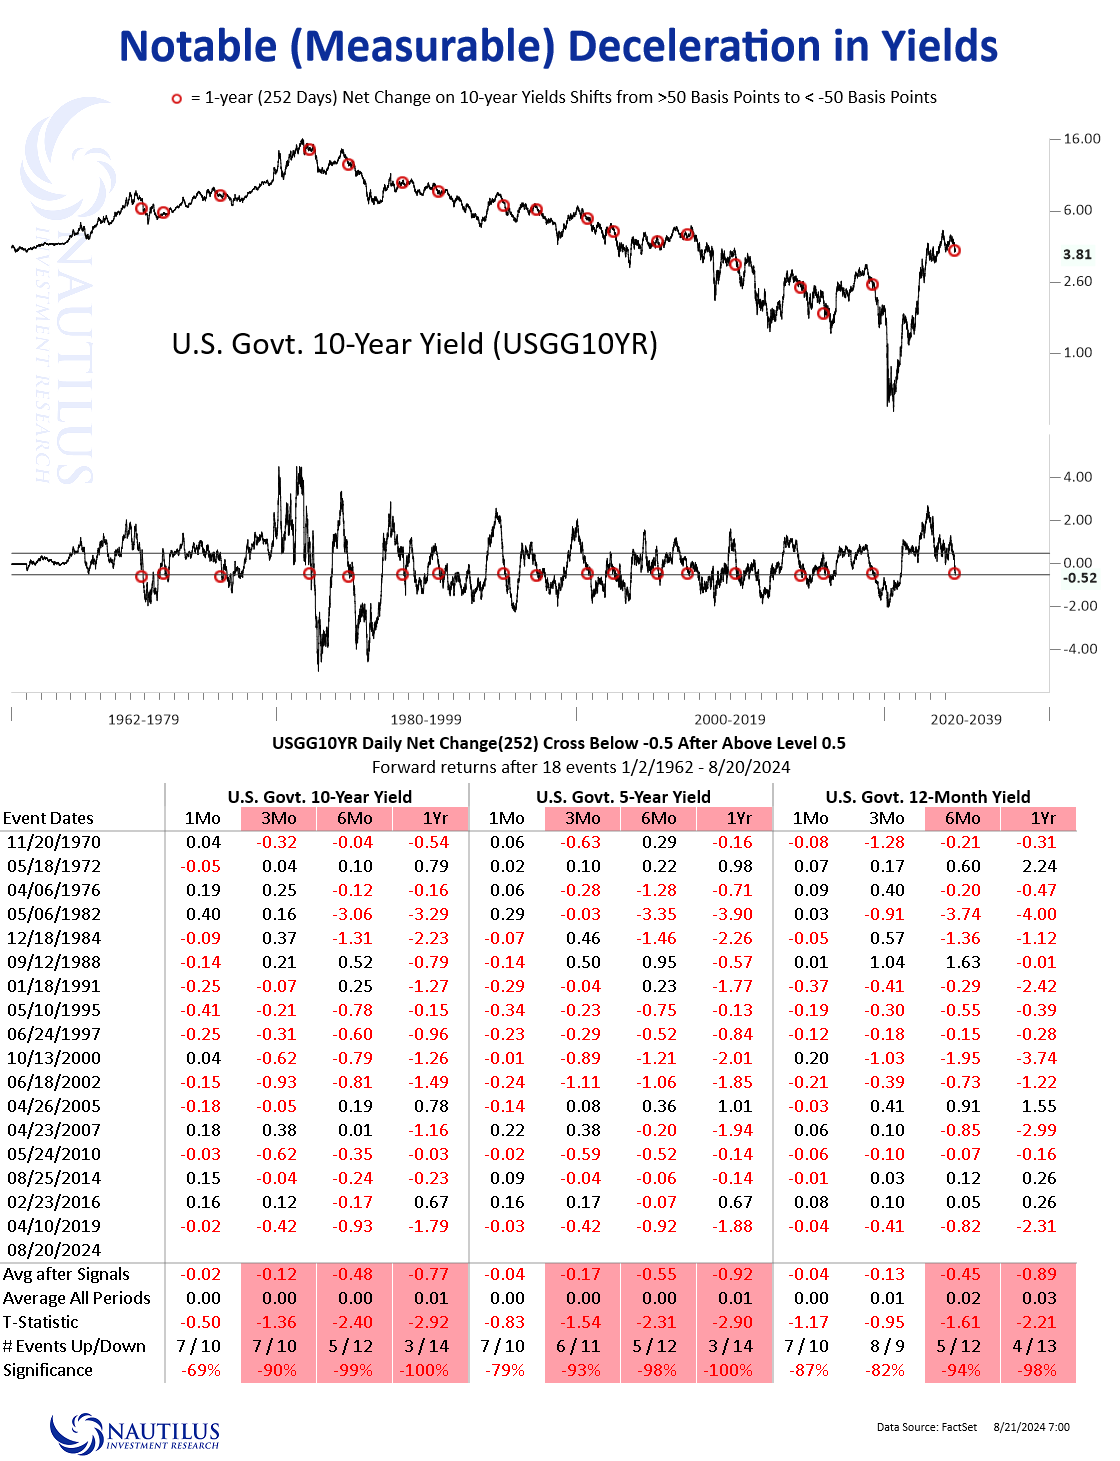
Significant Deceleration in 1-year Net Change in U.S. 10-year Treasury Yield

Over the past few months, we have consistently focused on U.S. yields, building a comprehensive narrative around a significant peak in rates. While much of our analysis has aligned with broader market consensus, our primary objective remains to deliver actionable signals and metrics. By examining historical precedents through various technical lenses, we aim to provide our clients and readers with perspectives that instill greater confidence in their decision-making.
Importantly, we were ahead of the curve in identifying the timing of peak yields—this is well-documented in our previous posts. Today, we bring attention to a new signal that points to lower U.S. yields across the curve. Specifically, when the 1-year net change in the U.S. 10-year Treasury yield drops below -50 basis points after previously exceeding +50 basis points, it historically signals continued declines in yields. The table below illustrates that 10-year, 5-year, and 12-month rates typically decline by approximately 50 basis points over the next 6 months and by 80 basis points over the following year.